Practice 06/08/26
Here is the boat-wide data for today's practice. As always, you can have a detailed look at your own data with your XBoat account. A future update will have a centralized way for coaches to push out specific boat-wide stats to the athletes.
Getting started, here is the legend (which associates each athlete to a color) as well as the detected intervals for today's row:
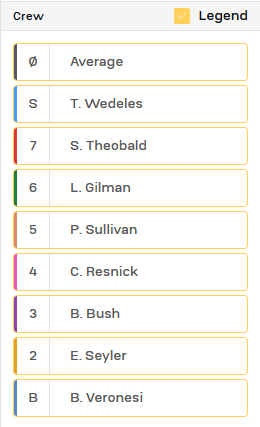
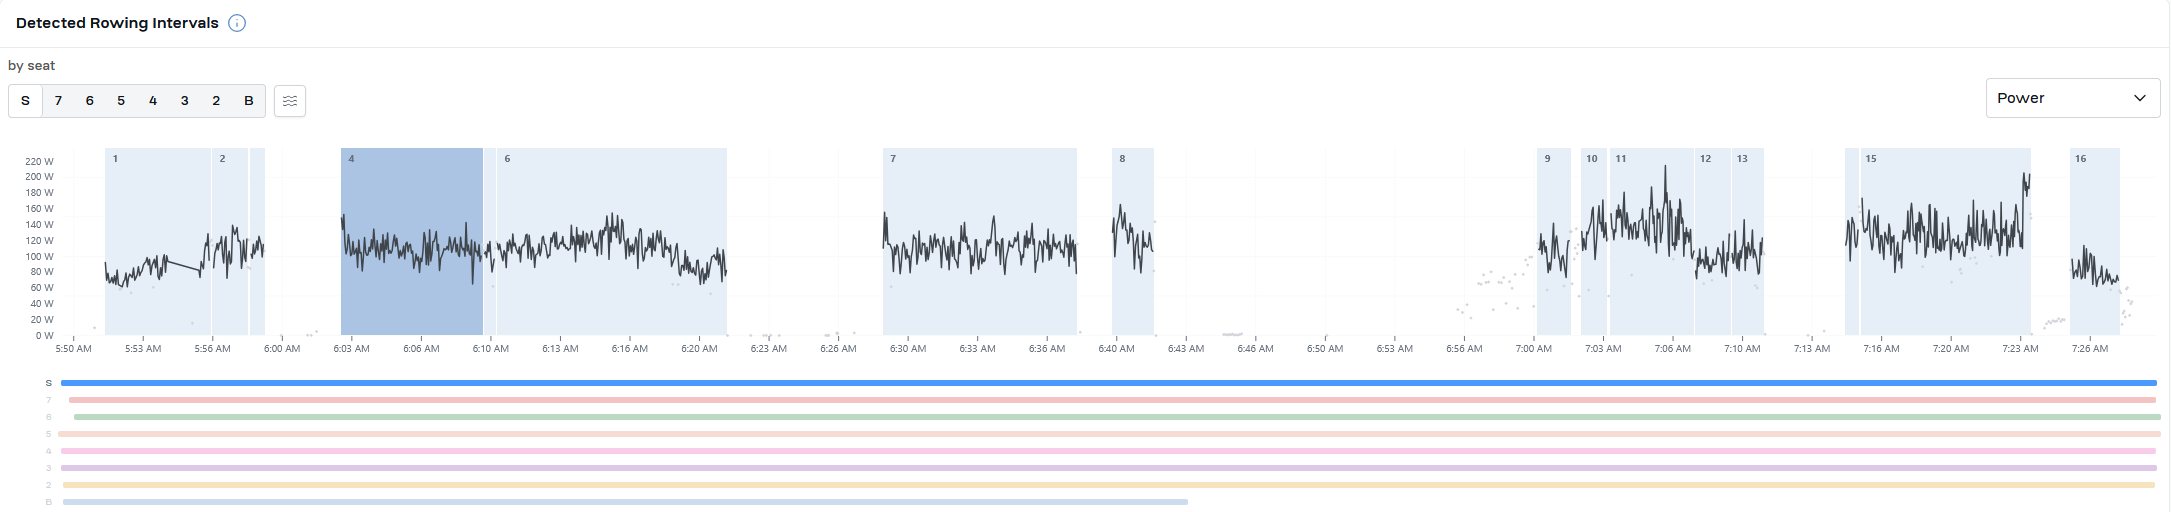
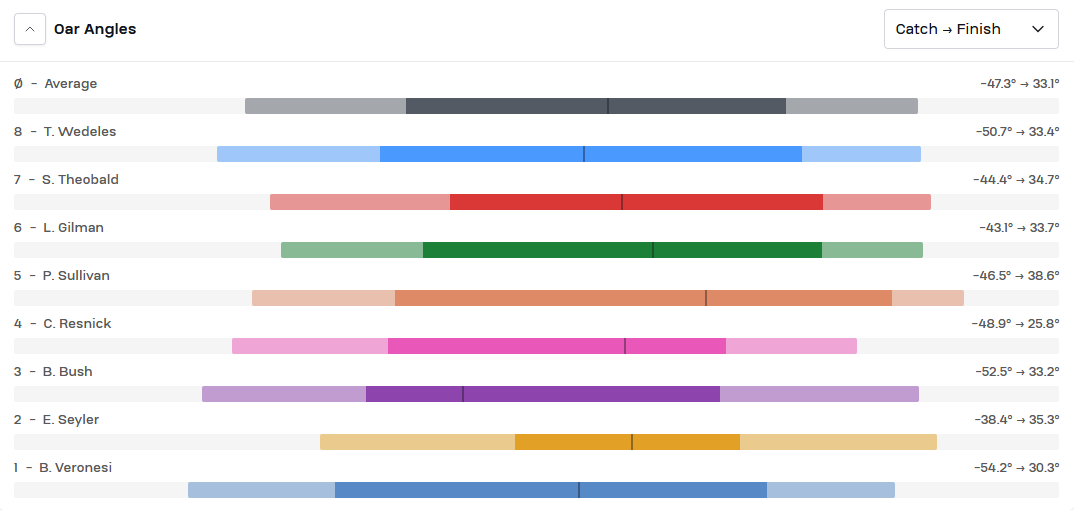
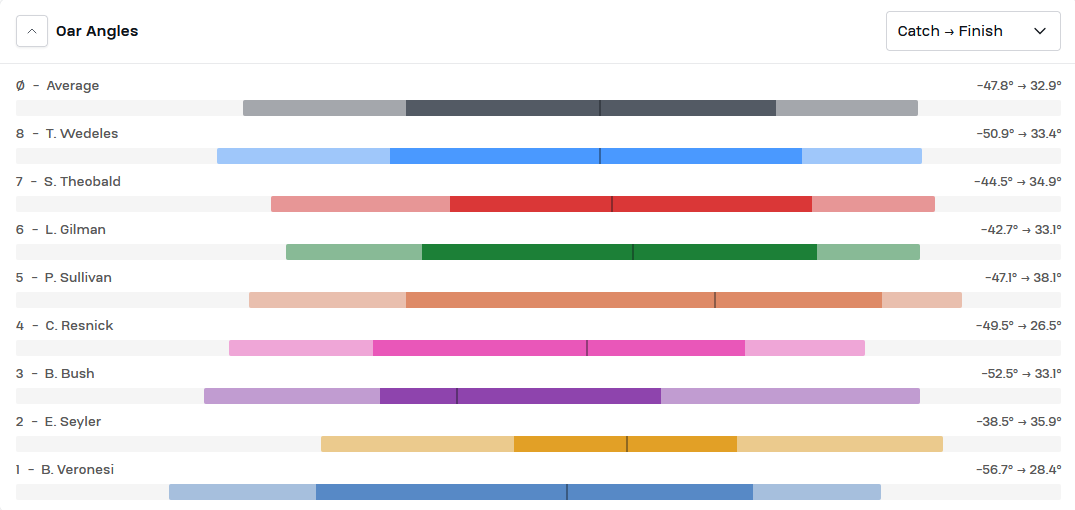
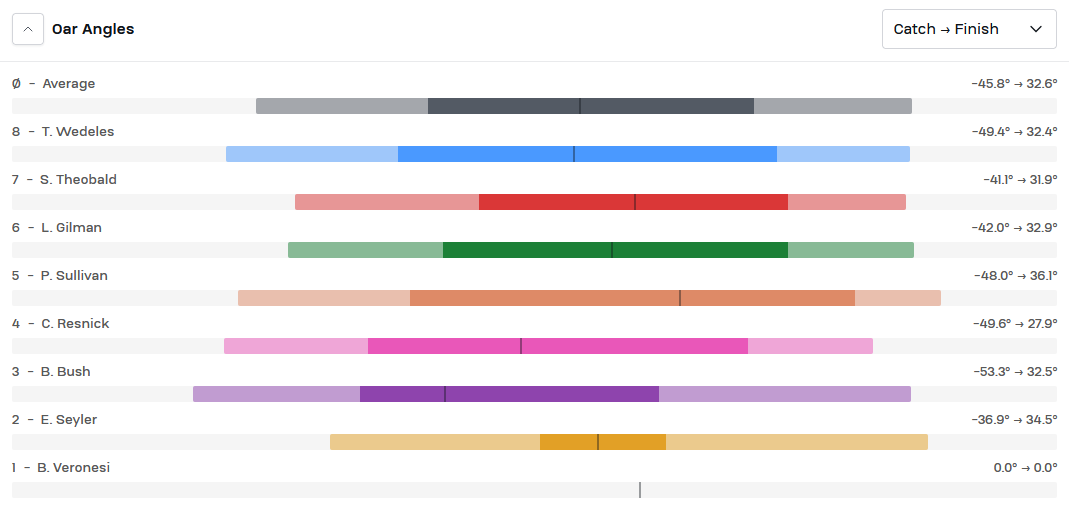
If you can't see the colors very well, you can use the Oar Angle bar charts below for reference. I was not in the boat so I am not exactly sure what happened where in terms of relating your pieces to these intervals, but I have chosen to display boat-wide stats for intervals 4,7 and 15.
Also note that Bill's display unit ran out of battery shortly after interval 8. (as indicated by the bars below the sessions).
Starting with the data from interval 4:
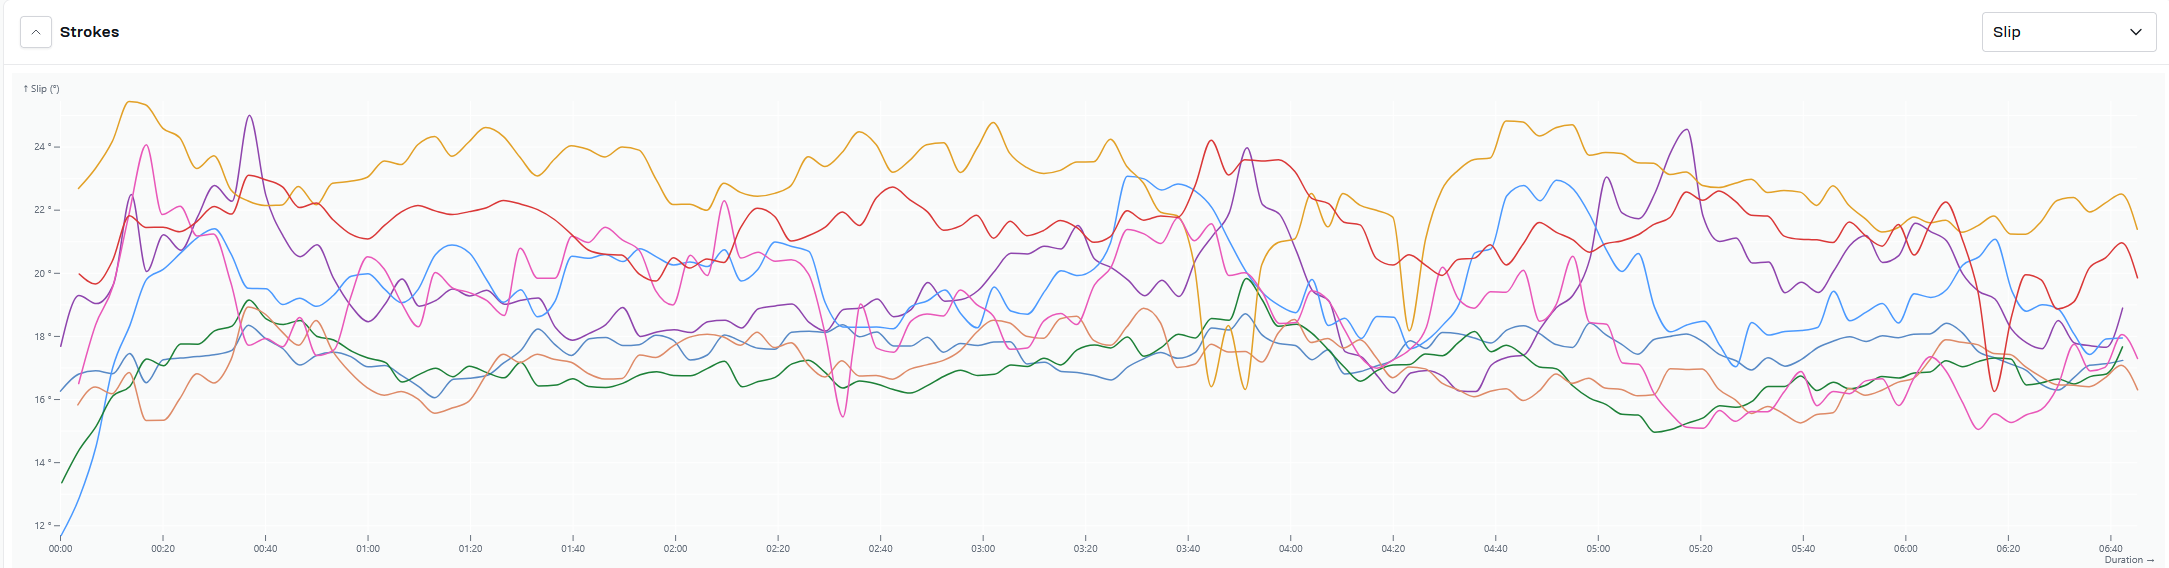
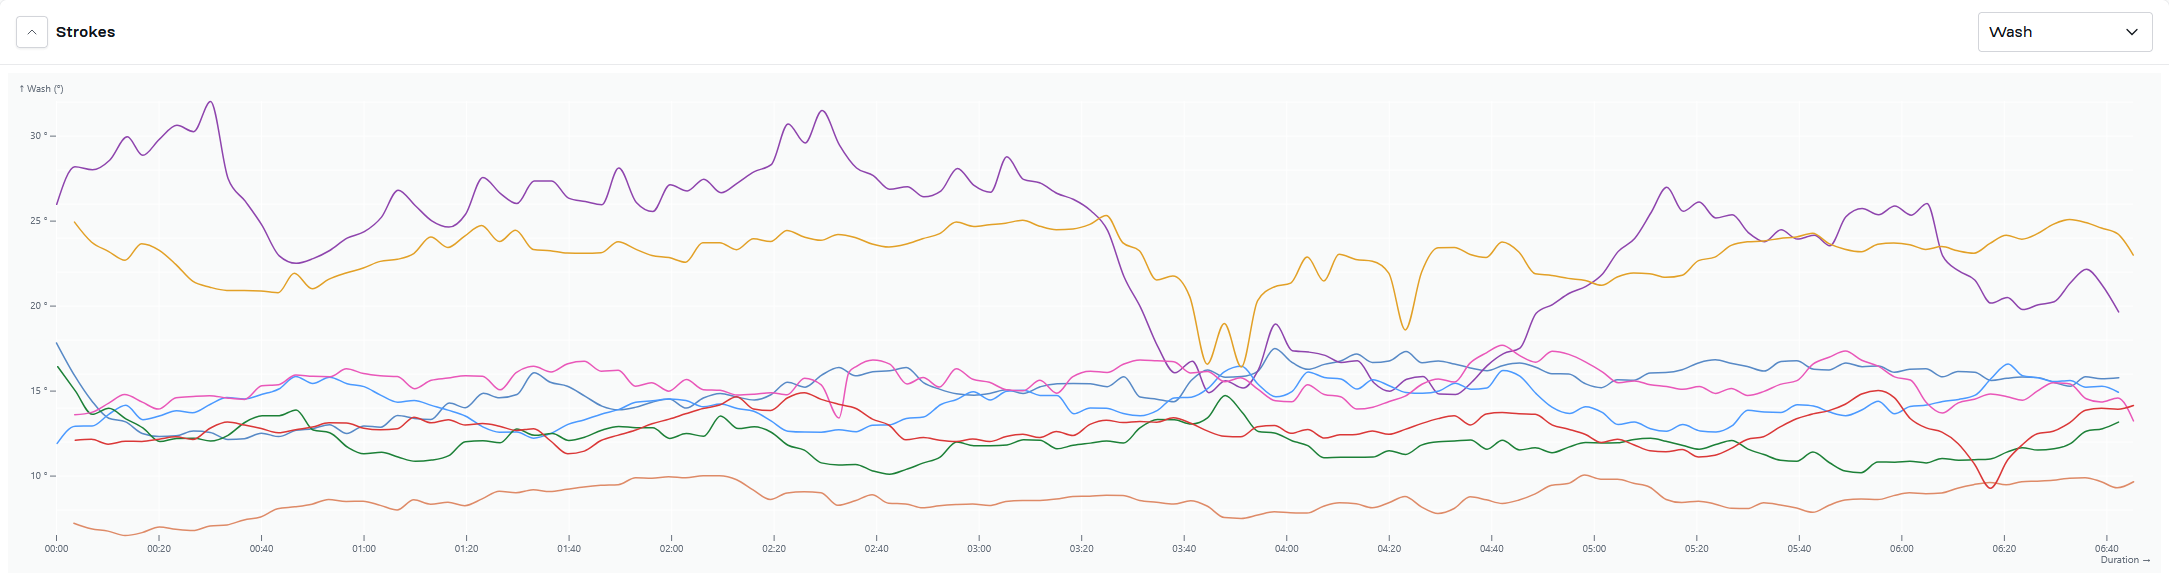
Click on any image to enlarge!
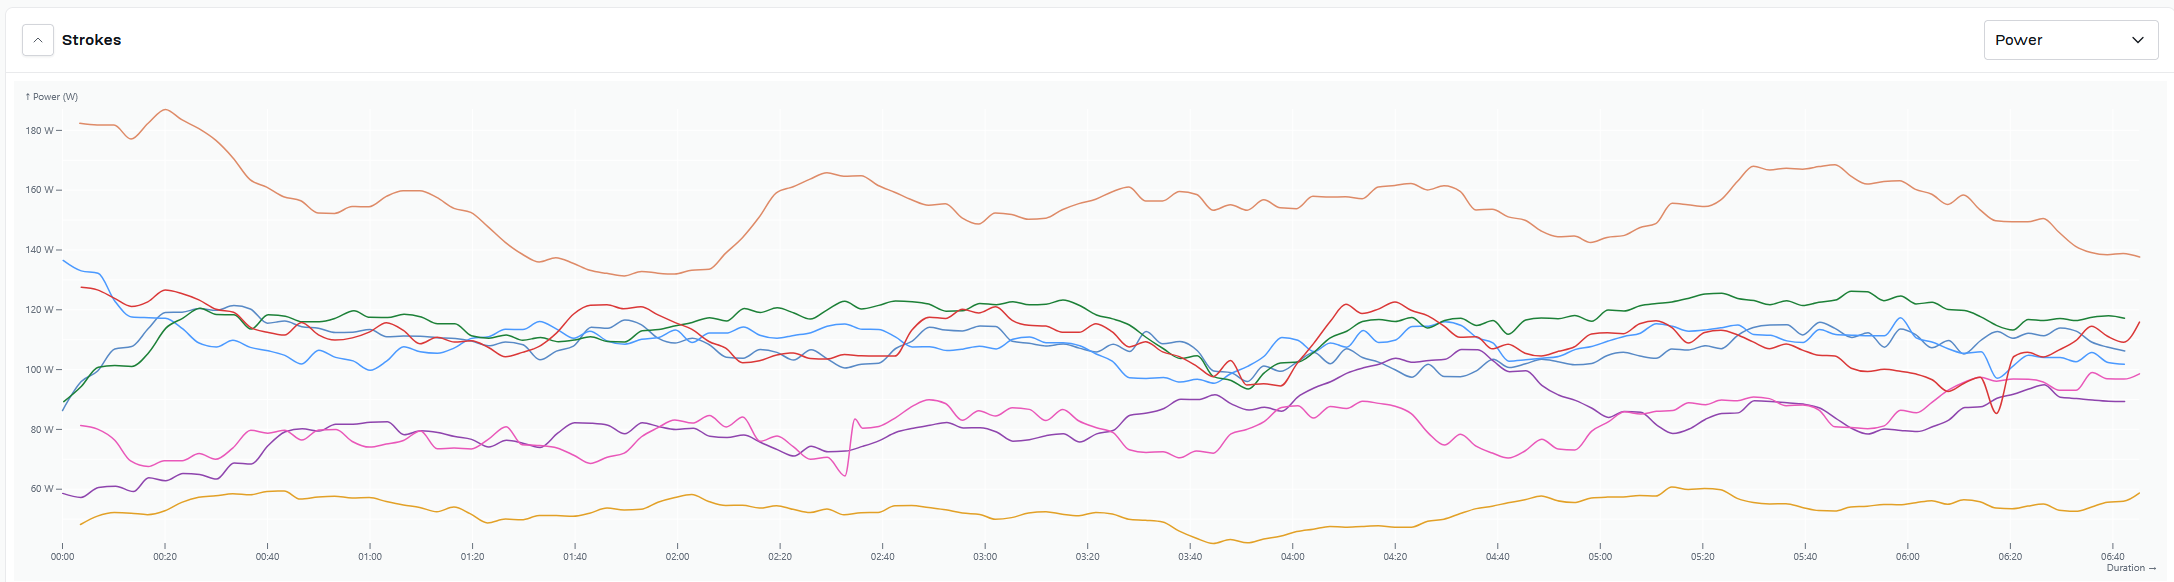
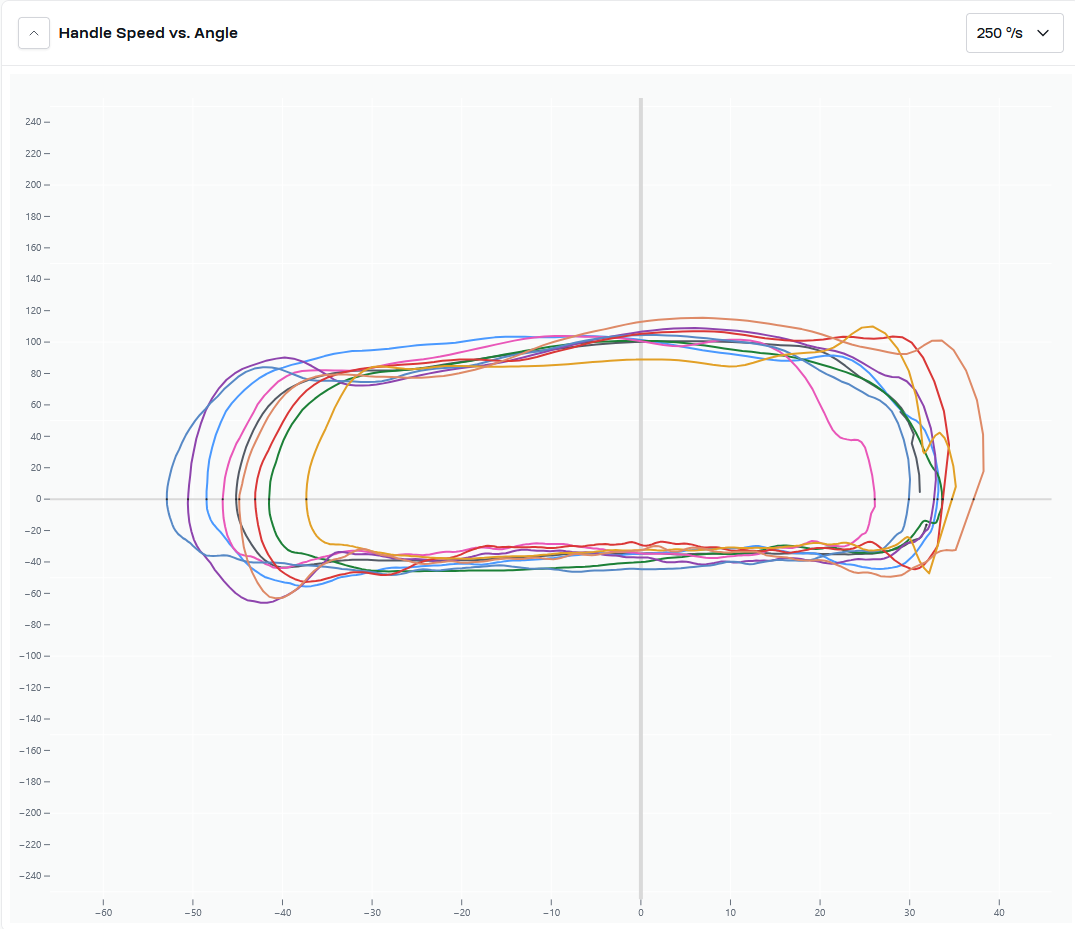
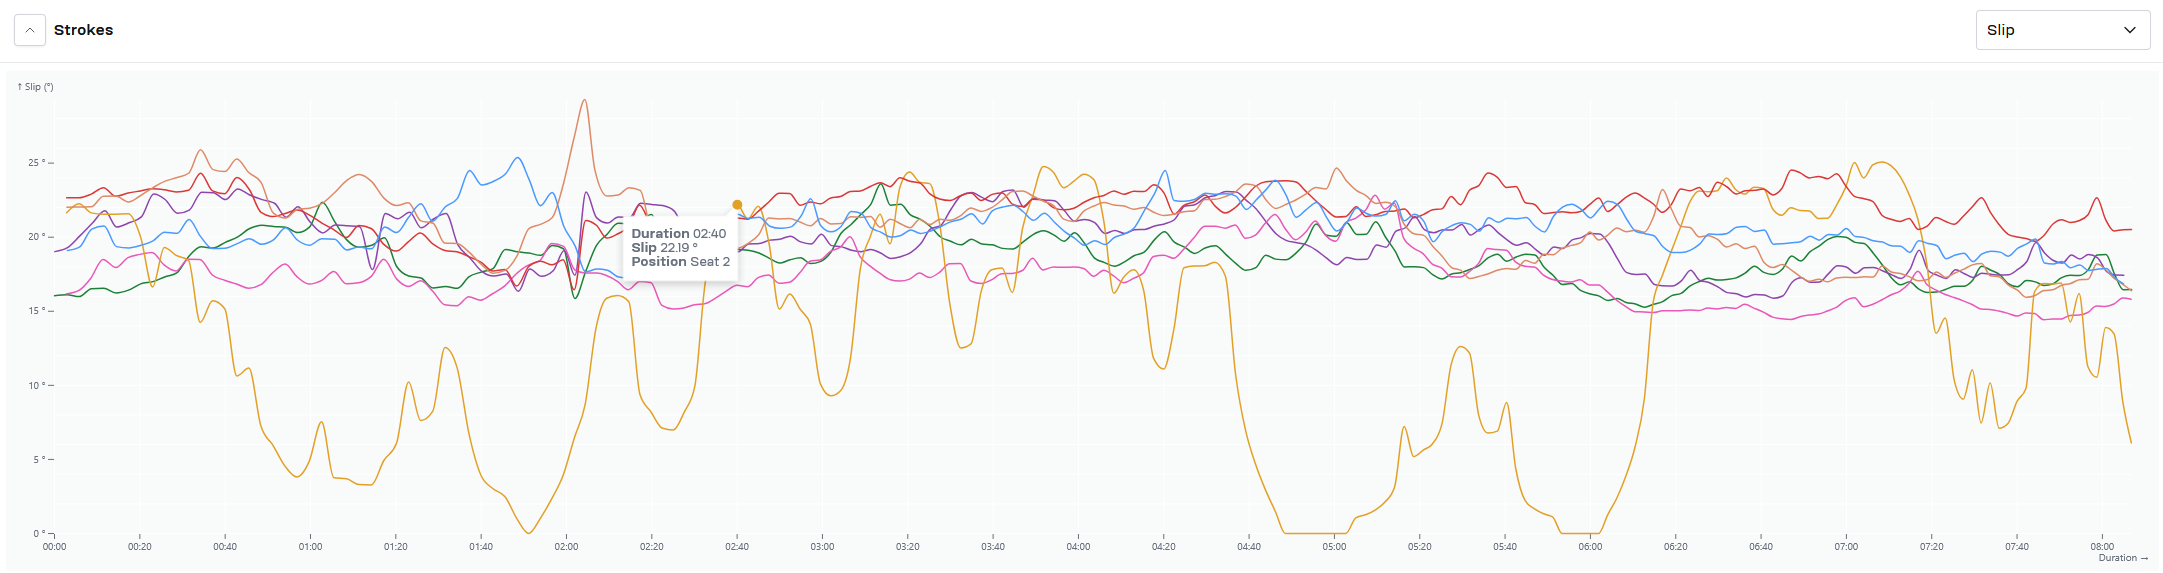
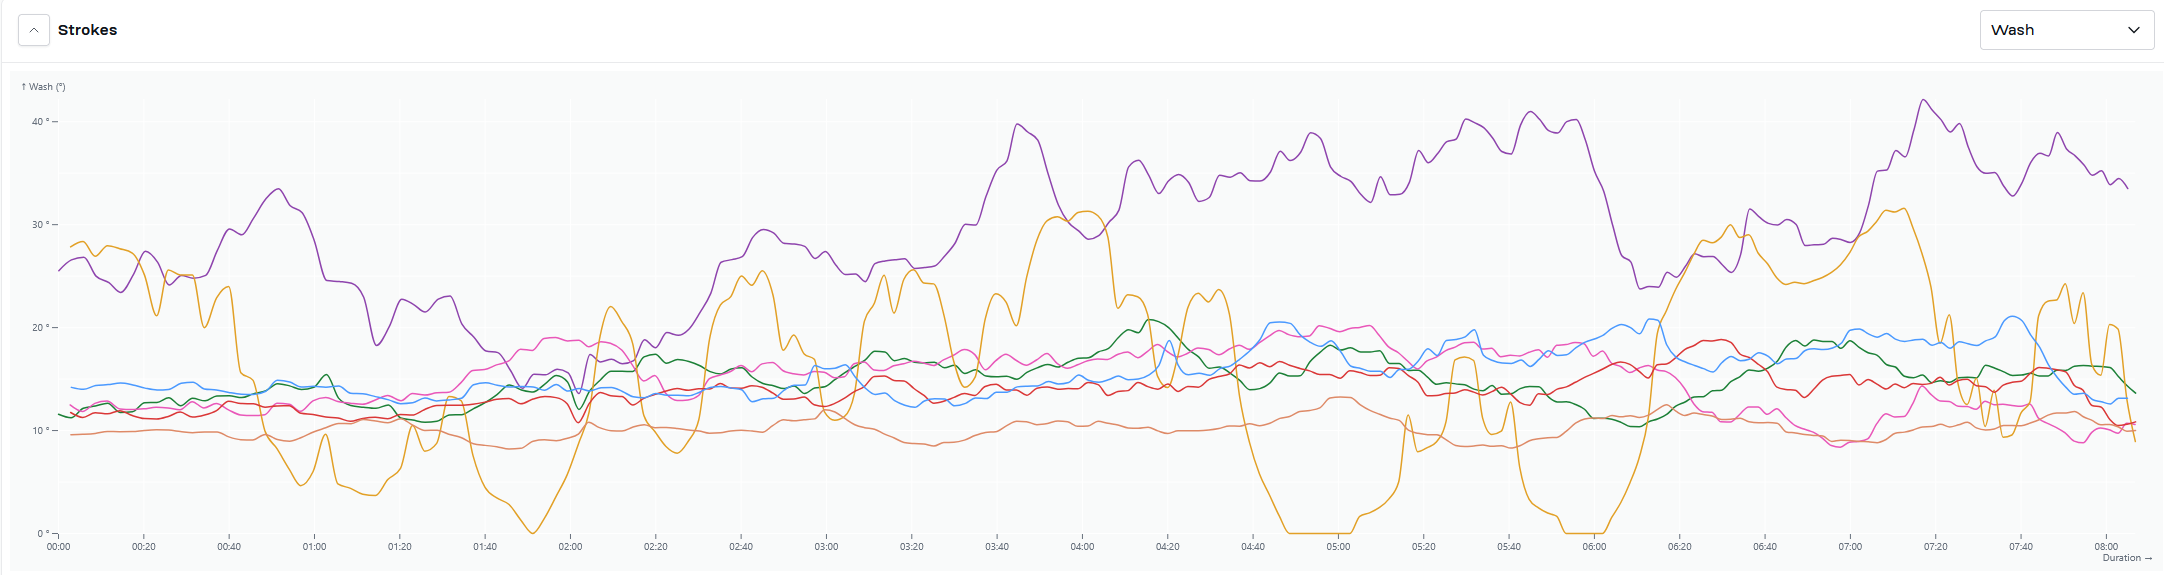
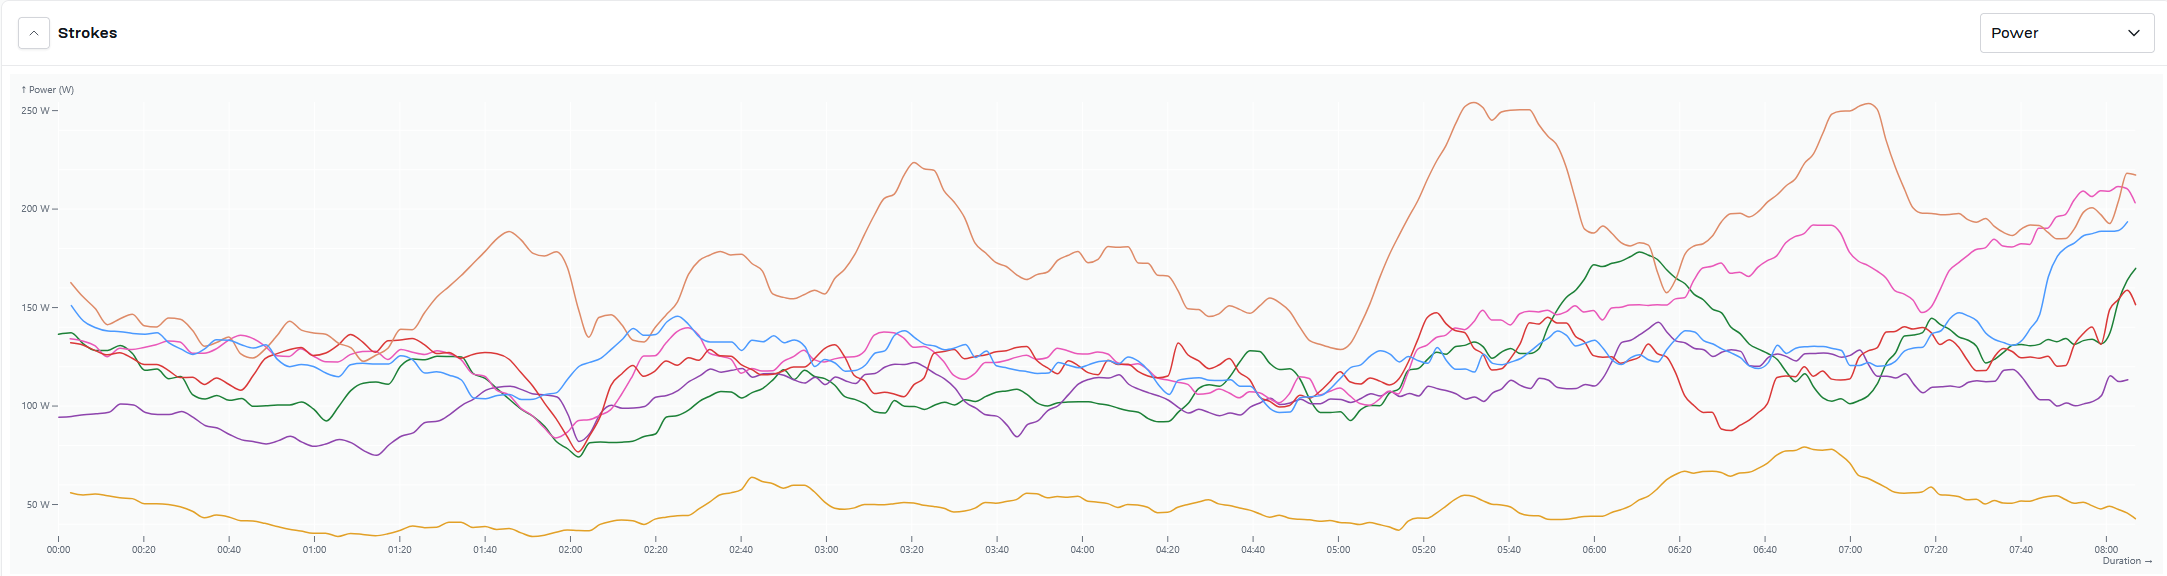
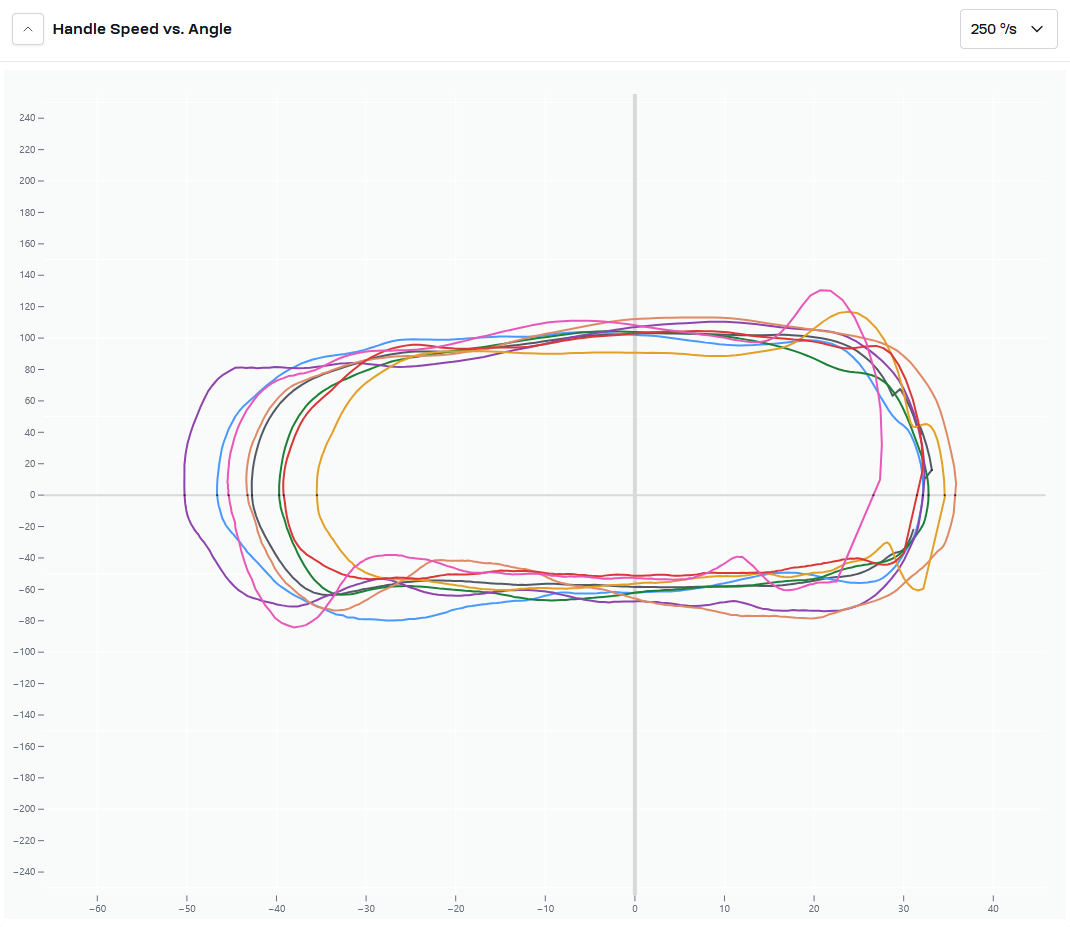
The first three graphs are slip/wash/power over time. The next graph is handle speed compared to the angle of the oarlock, so how fast are your hands/handle at the given angle of the oarlock (the given point in time in the stroke).
Next is the Oar Angles bar chart, easily one of my favorite visualizations. The more saturated color bar is your connected length, whereas the tinted ends are length lost to slip and wash, and the lines are your peak angle (think top of the force curve). This chart really illustrates how much of the drive is lost to slip and wash, and although you may be getting rotation and length, it's not actually getting applied!
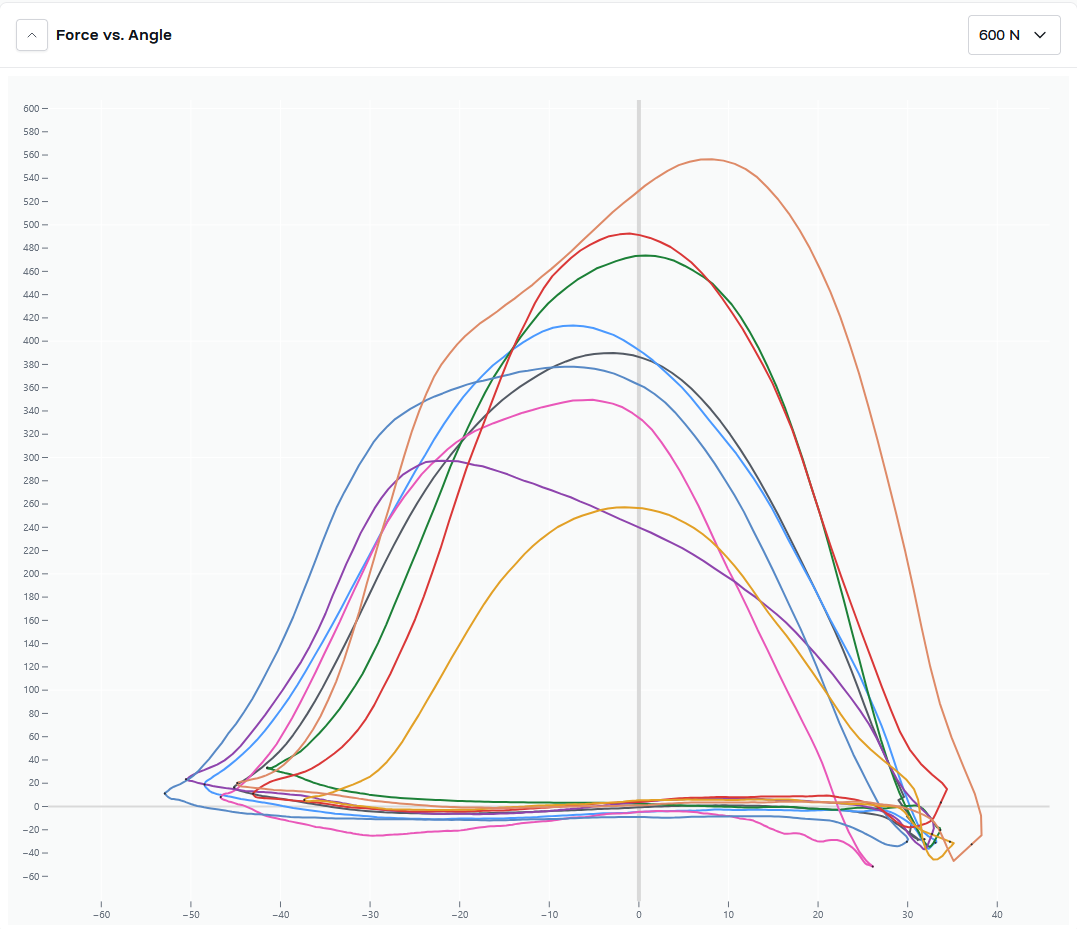
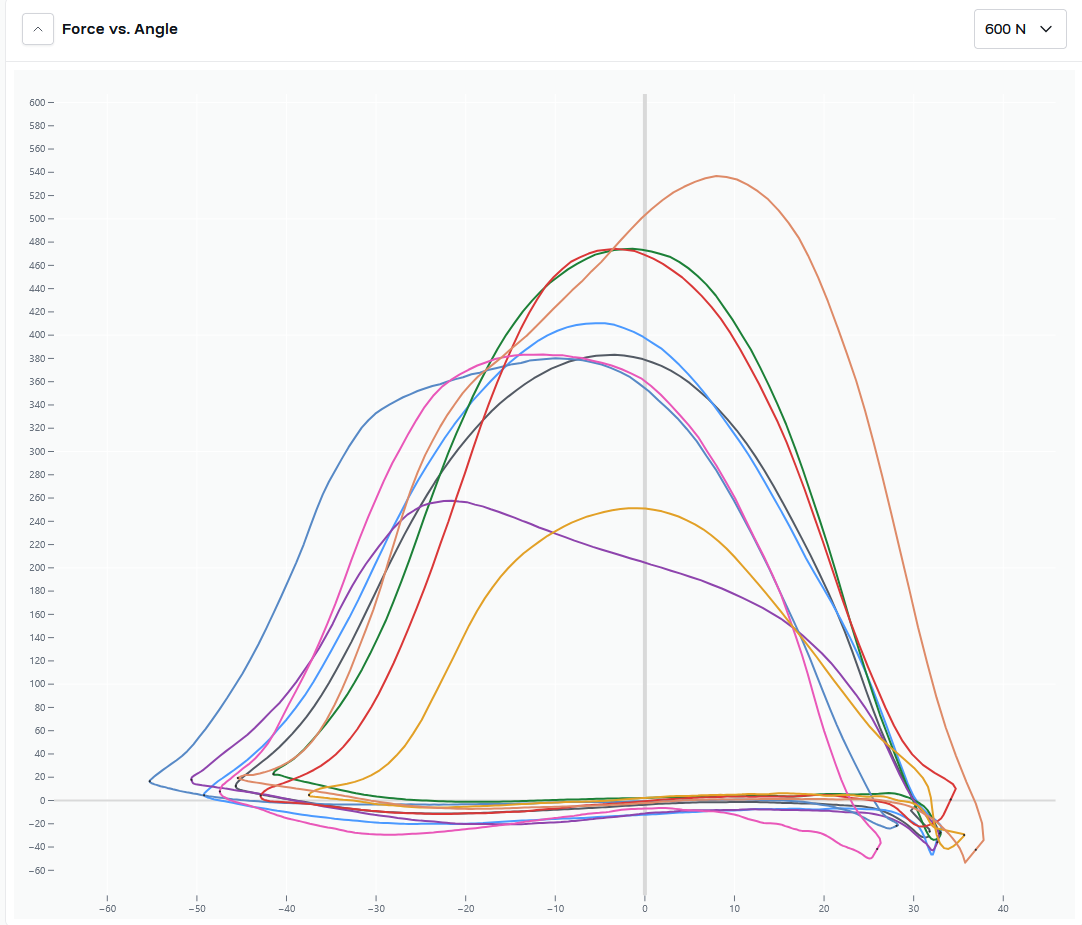
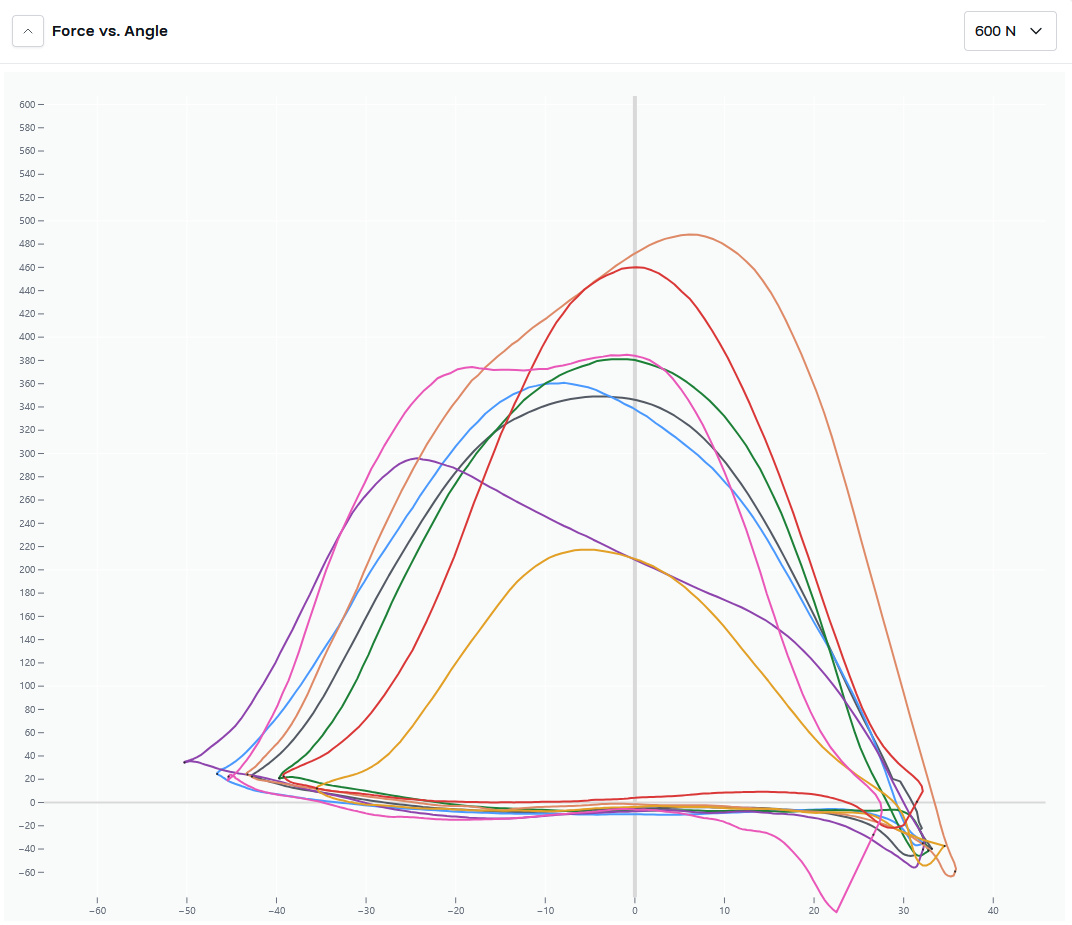
Lastly is the force vs angle graph which is your force over the duration of the angle. This is essentially your average force curve for interval 4. The goal is to align the peaks of these curves to maximize acceleration of the boat.
Let's move onto the next two intervals. Here is the data for interval 7:
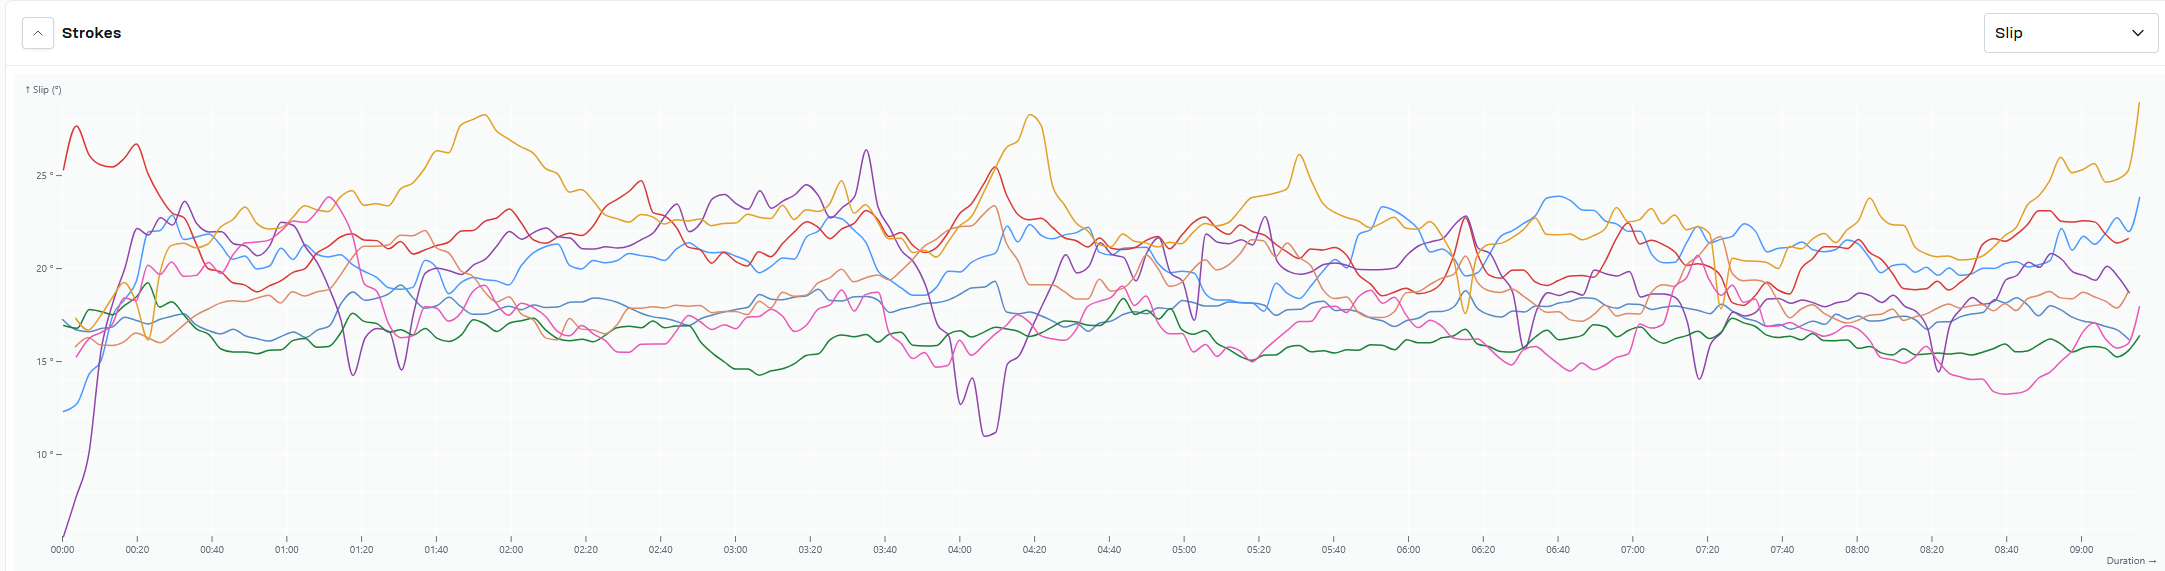
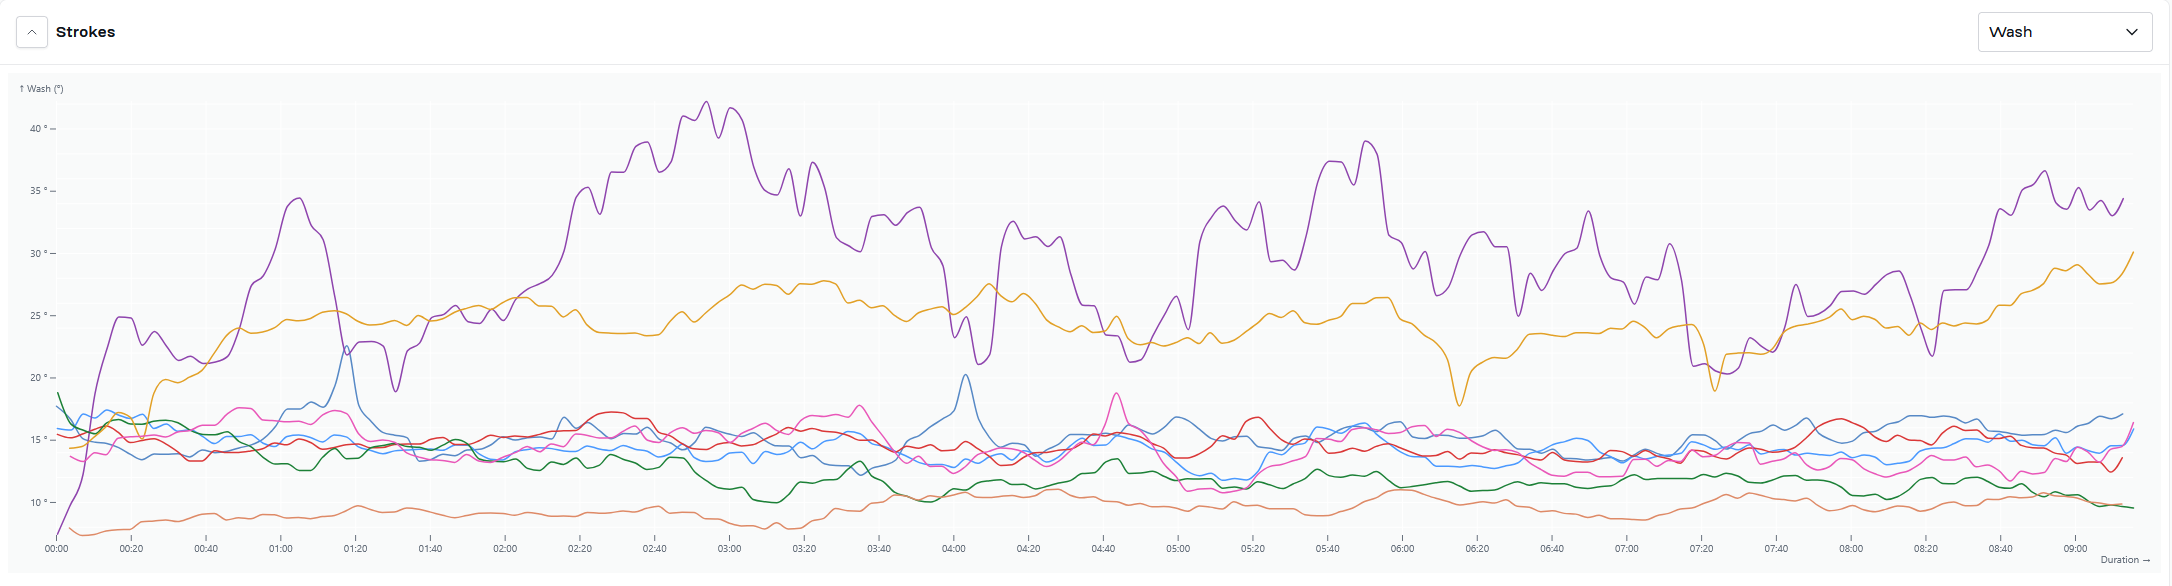
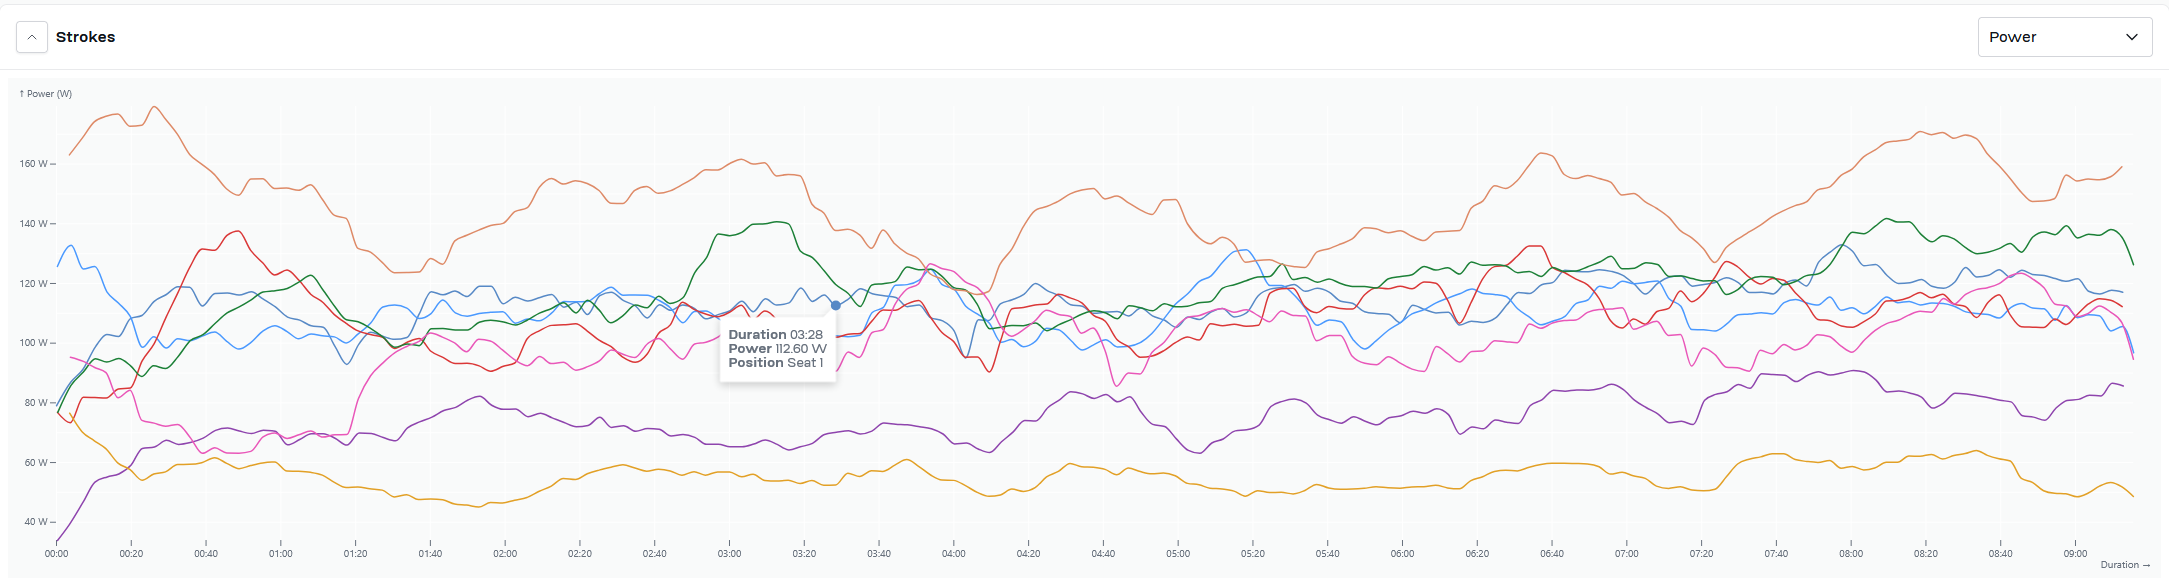
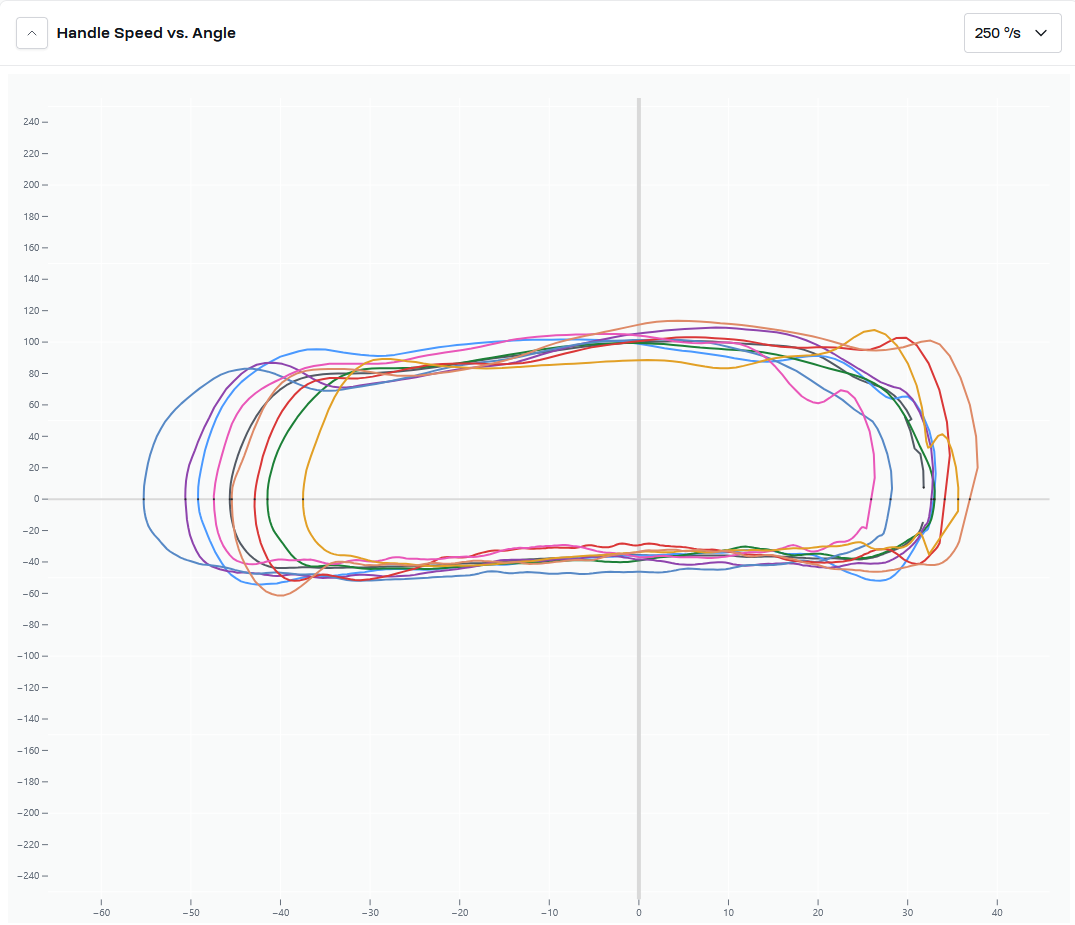
Click on any image to enlarge!
Lastly here is the data for interval 15:
If you have any questions regarding these graphs/charts please feel free to ask myself, Steve or AJ!